|
Taipei, Taiwan,December 8, 2003 - ABIT EQ™, part
of ABIT's exclusive µGuru™ technology, is the most comprehensive and user-friendly
windows-based hardware monitoring interface available. For the truly hardcore
overclocker and tweaker, ABIT EQ™ acts as an information resource, delivering
up-to-date status on vital system parameters. It offers:
- Speed monitoring for CPU, OTES™ and north bridge fans
- CPU, system, and PWM temperature monitoring
- CPU, memory, and PSU voltage monitoring
Only ABIT EQ™ gives this level of system status, all in an easy-to-use
Windows-based interface.
Why ABIT EQ™?
With ABIT EQ™, users have the most extensive motherboard diagnostic tool
on the market, which means:
- Higher performance and system stability
- Greater system tweaking safety
- Enhanced system monitoring capabilities
With this guide, users can get the most out of ABIT EQ™ equipped ABIT
motherboards.
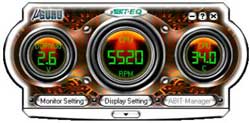 |
Here is the ABIT EQ™ dashboard. This is the SubScreen, or compact
view, which gives you the most vital system information. DDR voltage,
CPU Fan speed and CPU temperatures are pictured here, but the parameters
displayed are fully selectable. |
|
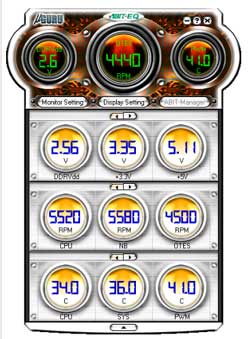
Ahhh, the Main Screen, or extended view. This mode
offers a plethora of system parameters, giving you more insight on
the inner workings of your system. A godsend for those looking for
the maximum stable overclock. After all, what's performance without
stability? |
 |
On the monitor setting screen, you can set the high
and low thresholds for voltages, fan speeds, and temperature settings.
You can even set it so that your system will automatically shut down
if one of the thresholds is breached. Now that's security. |
 |
The Display Setting dialogue lets you customize which items are
displayed on both the Main Screen and the SubScreen. Additionally,
you can have the system automatically send you an e-mail when it detects
a parameter is approaching your pre-determined thresholds. How's that
for convenience? |
|